Why I Switched from Google Analytics to Fathom Analytics
Google Analytics saved us all from AWStats hell. When GA was first released in 2005, webmasters everywhere rejoiced for the free alternative, with accurate numbers and a boatload of features. As time went on, Google strengthened its grip on web traffic, while user privacy and clean interfaces went the way of the Dodo.
Welcome to Fathom Analytics
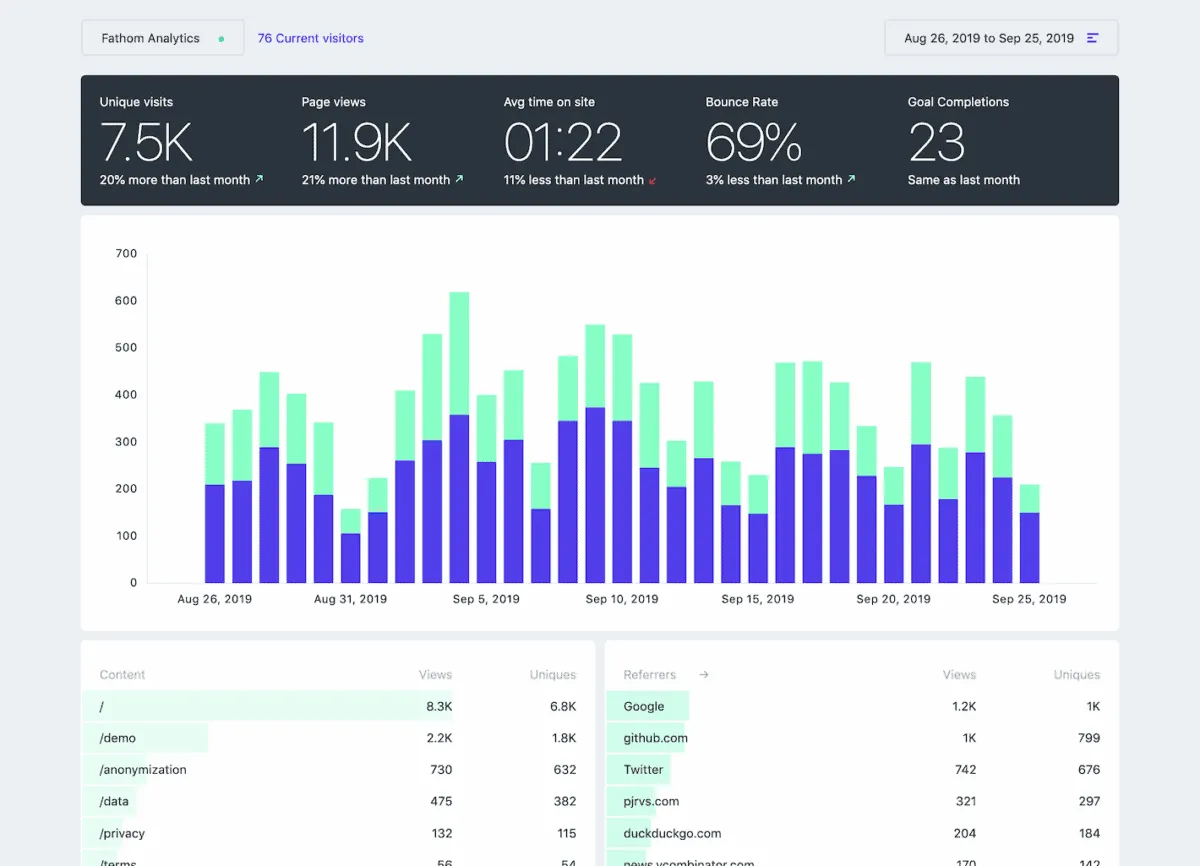
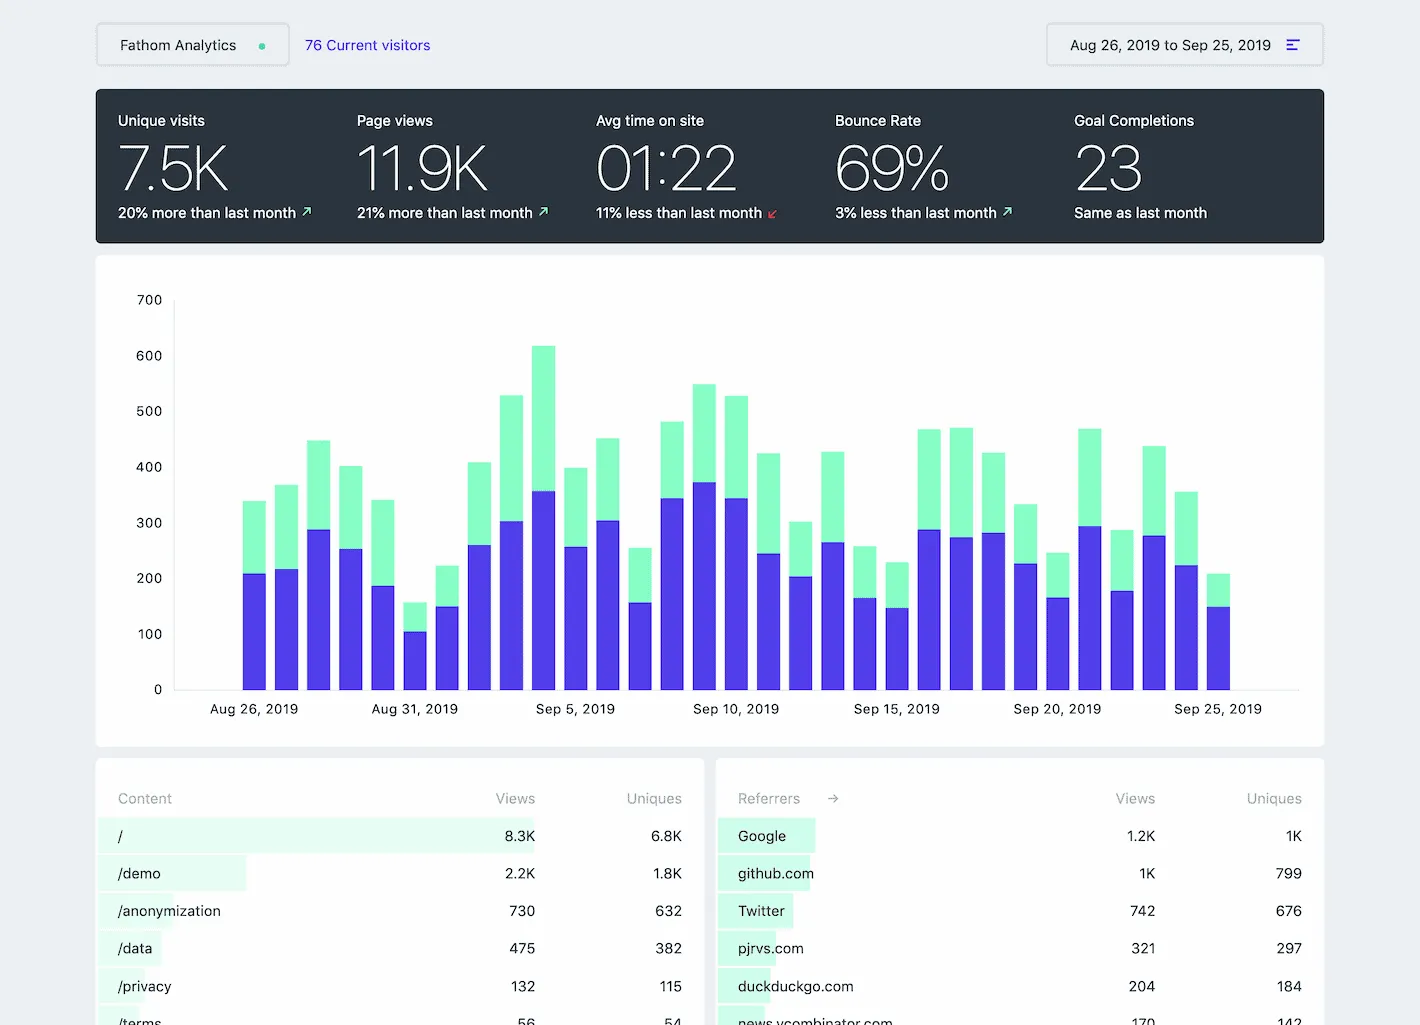
See everything you need on your Dashboard (what a concept)
Fathom Analytics is a powerful yet simple analytics platform. The simplicity is what got me excited about the platform. I actually get to see all my data when visiting my Dashboard. I can even see my goals (more on that later) at a glance.
Contrast that with Google Analytics where I have to dig down to see most of my data. You can customize your Dashboard on Google to display more of the information you want, but I hate having to carry this across all my different sites.
Multiple Sites on the Same Account
If you run multiple websites or apps, you don’t need to create an account for each one. Switching between sites is as easy and you would expect with Fathom.
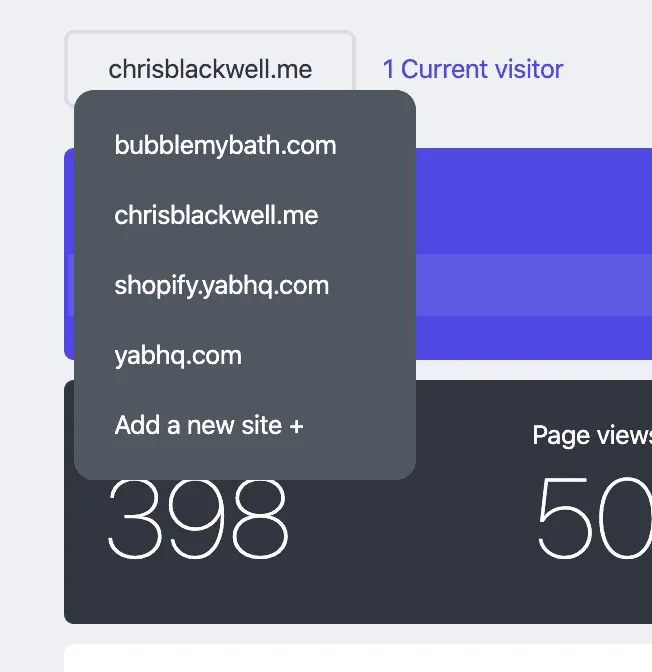
I find this so much easier to use than Google’s Accounts => Properties => Views. I didn’t realize how much I hated it until I switched sites in Fathom. It was easy and intuitive.
Changing Your Data’s Time Period
By default, Fathom will show you your data over the last week. If you want to change what period you are looking at, simply click on the dates in the top right corner. You’ll be presented with a dropdown as shown, with some very handy presets on the left side.
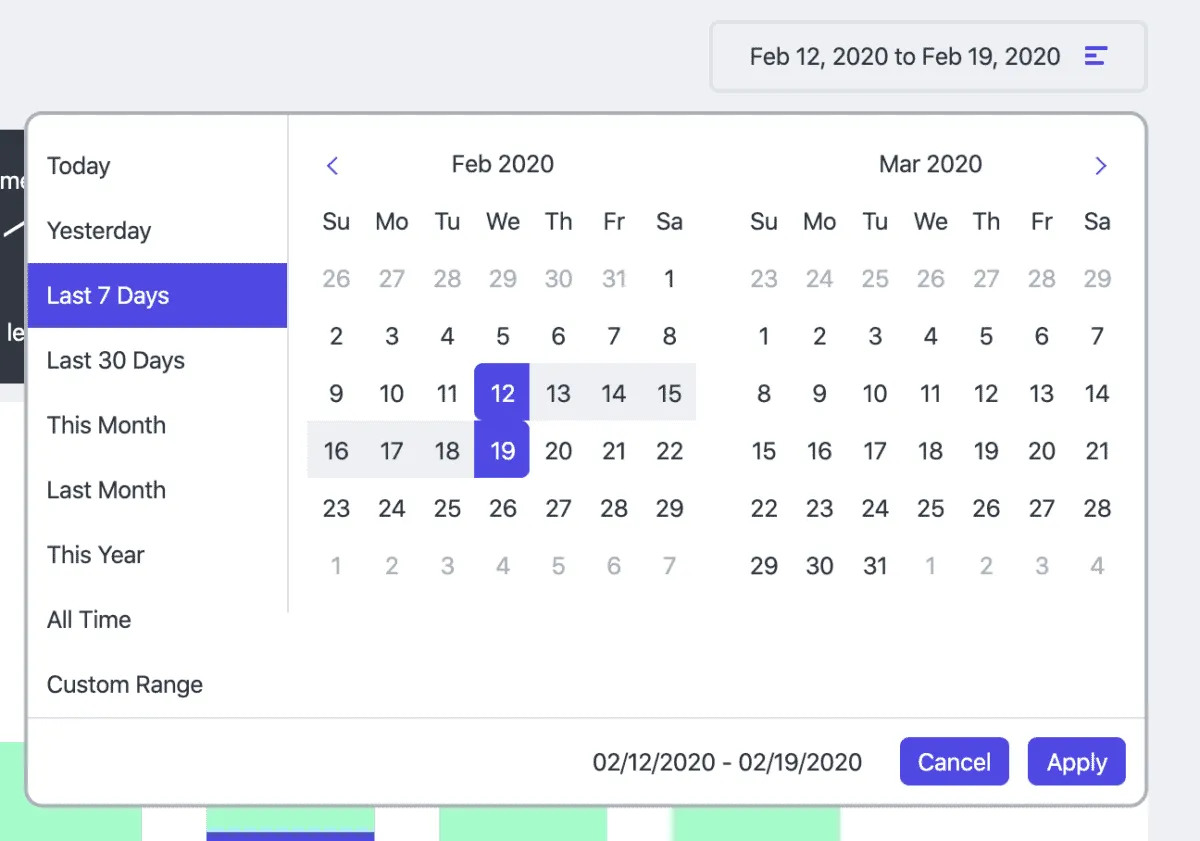
Click Apply and your data will be instantly changed. You’ll see a nice little animation as the graph changes, to give you a visual clue that the data is updated. Like all things Fathom, they sweated the details on this.
Know Your Customer
You need to know what pages your visitors are going to most often and how they got there. We can see this data easily at a glance.
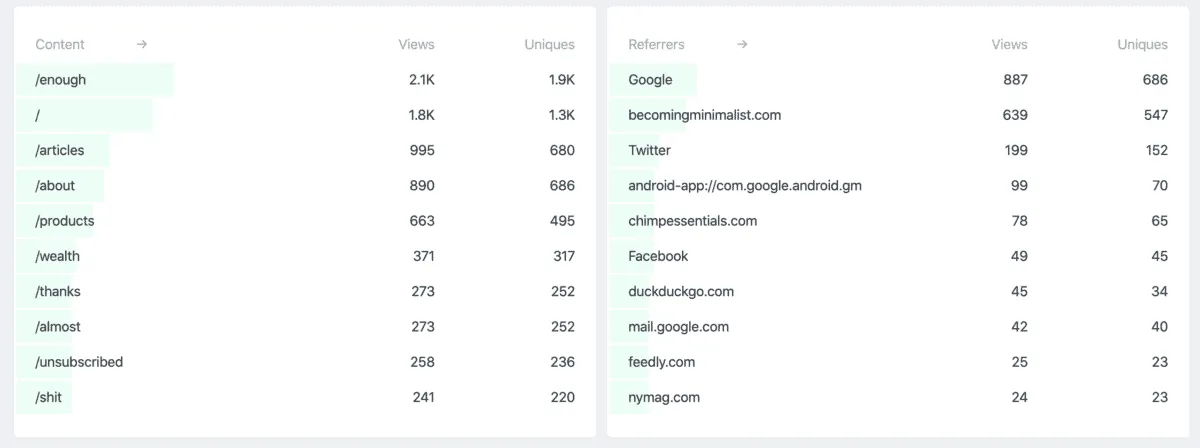
The left column is displaying the most frequently visited pages, ordered by total views. The right column shows the top referrers to your website, also ordered by total views.
One thing I would love to see Fathom add here is a percentage indicator showing the page visits as a percentage vs the total page views of the website. While I could run this math myself, I think the helper could be minimalist and helpful.
Devices, Browsers, and Countries
Another section of data you can look at is the user device and geographical section. This includes what type of device the user is one, the type of Browser and the Country of origin.

From left to right we have the user’s device type, the browser they were using, and what country they are from.
The device type column I find unnecessary and a little behind the times. My iPad Pro has a higher resolution than my MacBook Air but is still considered to be a mobile device and get lumped into that “Tablet” category.
We have gone beyond device type in web development, and screen size matters so much more. I would love to see this column change to screen resolution in the future.
I have the same issue with the Browser data. Looking at the screenshot, we can see that 1.1K unique visitors were using Safari. Mobile Safari, Desktop Safari, or both?
The Country data is pretty standard and serves its purpose. In the future, I’d like to see the ability to dive deeper into provinces and/or states. This would be useful if you were running a targetted ad campaign for a specific city or state.
Goals - Finally Something Easier than Events
I knew I should be using more Google Analytics events for years, but I always had problems with them and found them difficult to configure properly.
Using Fathom, I was able to create a Goal and get it configured on my site within 2 minutes. Creating a goal is a 2 step process (3 seemed too complicated for Fathom).
- Create a goal by giving it a name
- Add the click handler to a link
That’s it! Were you expecting more? I recently created two goals for a landing page I was building to generate leads. I wanted to know how many people clicked the “Get a Quote” button vs how many actually filled out the quote form.
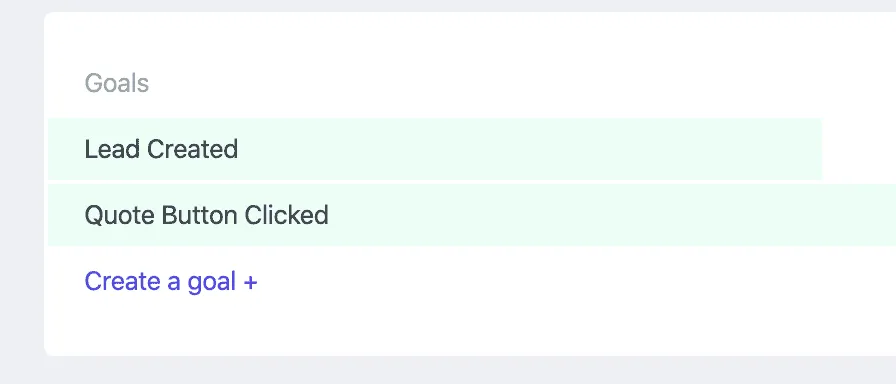
Adding the click handler is very straight forward. You simply add a small piece of code onto your link and Fathom takes care of the rest.
<a href="/quote" onclick="fathom('trackGoal', 'B5PGZD9N', 47599);">Get a Quote</a>The click handler takes 3 simple arguments. The event, in this case, trackGoal. The Goal ID, which is provided to you after you create your event. Lastly, you can define a value to the goal in cents. Above I defined the goal to be worth $475.99 so 47599 cents.
Email Reports FTW
You currently have one of two possible relationships with your website analytics. You either are checking them several times a day or even every hour (not healthy), or you never seem to check them (also not healthy).
Fathom can be configured to send you weekly, monthly or even custom reports. Receiving an email each week showing your stats across your different sites is very compelling.
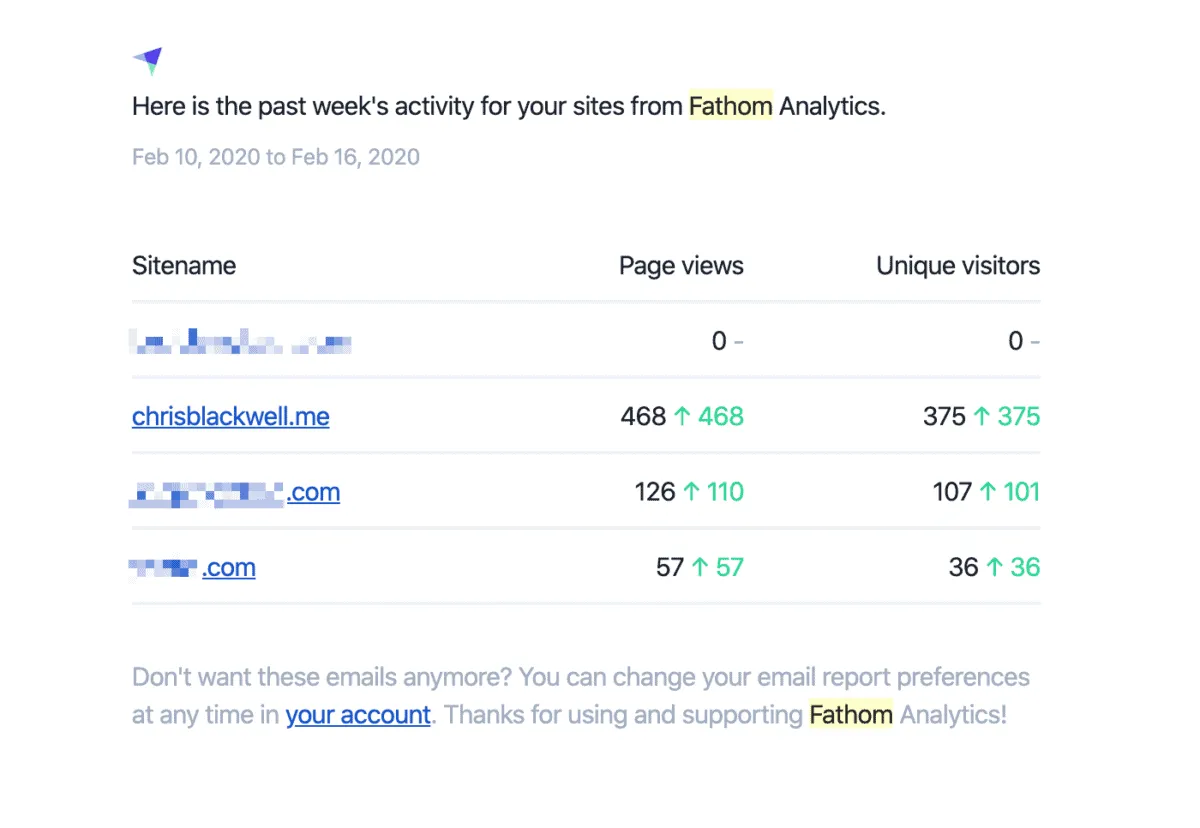
There were some site stats that I never checked. By getting a weekly email update from Fathom has let me keep an eye on sites that would otherwise have gone unnoticed.
Better Tracking and User Privacy
I’m going to let you in on a secret that Fathom doesn’t advertise. They track better than Google Analytics. Why? Ad Blockers. Google Analytics gets blocked by most ad blockers. Fathom doesn’t get blocked by most ad blockers for several reasons.
- Fathom is smaller than most analytic companies and will fly under the radar a bit more
- Fathom doesn’t use cookies
- Fathom is a privacy-focused company
At my office, we use a network-level ad blocker called Pi-hole. Pi-hole blocks all tracking and third-party ads from sites we visit, on desktop or mobile. What we have been noticing is that our visits to sites using Fathom are still being tracked.
Fathom cares about user privacy is a way no other analytics platform does. Fathom doesn’t use cookies so no need to have that annoying cookie banner pop-up on your site. They are also GDPR and CCPA compliant.
Features I Wish Fathom Had
Fathom is not without any flaws, and if you need the below features on some of your sites, you may need to look elsewhere.
Site Sharing
Many of my clients add me to their analytics so I can check on their traffic and help them make decisions. For my clients that are on Fathom, I don’t have a great way to see their analytics.
The current way is for them to share analytics with a password. It would be nice if I could easily switch between sites using the top left “site switcher”. This keeps some larger clients I have off of Fathom because they need their team to be able to see their analytics without sharing a password.
Better Breakdown of Bounce Rate
If you told me your bounce rate was 65%, I would ask “On which page”. If you are running ad traffic to a single landing page, that page is going to inflate your bounce rate.
For example, let’s say you normally get 3000 visits to your site each month with a bounce rate of 50%. In March you run a generic ad to try and capture email interest for a new project you’re working on. If you drive another 3000 visits to that page with a bounce rate of 90%, your new bounce rate for your site will be 70%. That 70% doesn’t really tell the story of your website as a whole.
Conclusion
Fathom Analytics is a privacy-focused company that delivers a compelling experience, tracks better than its competitors, and keeps the interface clean and simple.
I’ve been using it on my site for a month and I am already blown away with the difference. My site is faster, loads less information and tracks better.
You can sign up for a 14-day free trial to see if it’s a good fit for you. You can use this link to get a $10 coupon (yes it is my affiliate link, but I am a paying customer and use them on my own site).
